AP® MICROECONOMICS:
|
|
Externalities of production and Consumption
|
Learning objectives
|
Market Failure
In economics, market failure is a situation in which the allocation of goods and services is not allocatively efficient. That is, there exists another conceivable outcome where an individual may be made better-off without making someone else worse-off at the same time.
Allocative efficiency is a state of the economy in which production represents consumer preferences; in particular, every good or service is produced up to the point where the last unit provides a marginal benefit to consumers equal to the marginal cost of producing. The value that consumers place on the consumption of the next unit (marginal unit of output) of a particular good or service is reflected in the price of that product. Allocative efficiency is achieved when the price of the next unit of consumption is equal to the marginal cost of production. Marginal cost is the change in the total cost that arises when the quantity produced is incremented by one unit, that is, it is the cost of producing one more unit of a good. In general terms, marginal cost at each level of production includes any additional costs required to produce the next unit – the value of the resources used to produce that additional unit. It is only when the market is in equilibrium (supply = demand in a free market) that an allocatively efficient outcome is achieved by the market. The total size of the sum of the consumer and producer surpluses (social surplus) is maximised. And the free market fails to achieve allocatively efficiency when there is more than a temporary shortage or surplus. With a surplus, too many factors of production are being used in the production of a good or service which results in the over production and oversupply of the good to market. Conversely, a shortage is caused by the under allocation of resources by producers and too the under provision of a good or service that is being supplied to the market. In any market situation where the price of a good or service is not equal to the benefit gained from the next unit of consumption, and does not equal the marginal cost, then the market fails and the social surplus is not maximised. |
What is market failure?
What is marginal cost?
Fast food, fat profits
|
The marginal benefit curve is the demand curve
|
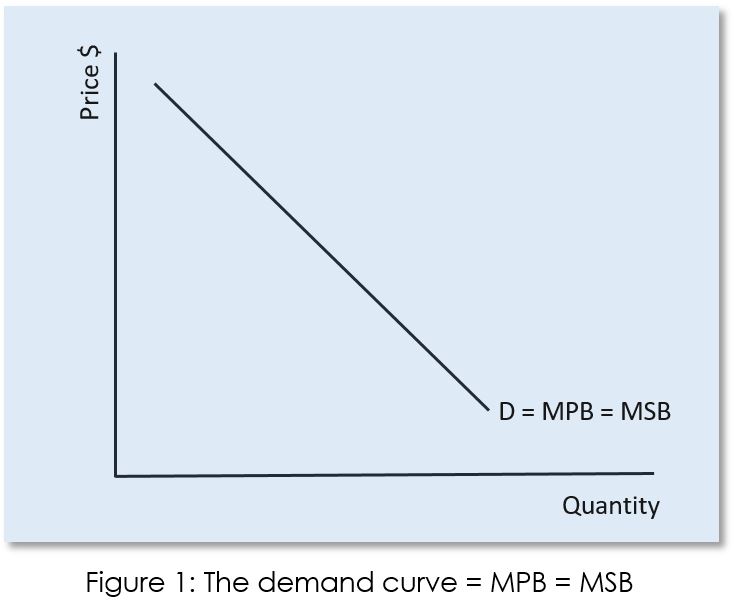
In a free market, the demand curve is both the marginal private benefit (MPB) curve and the marginal social benefits (MSB) curve; i.e., demand = MPB = MSB (see Figure 1).
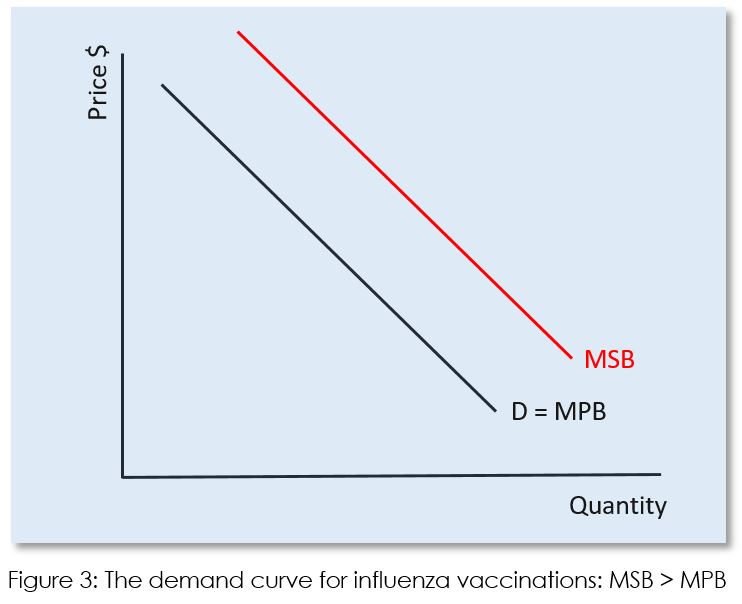
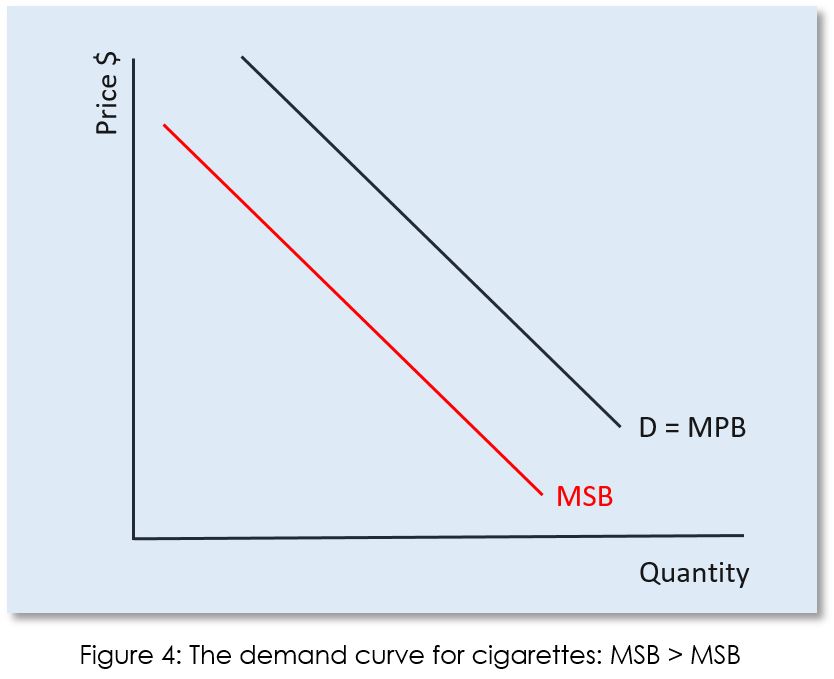
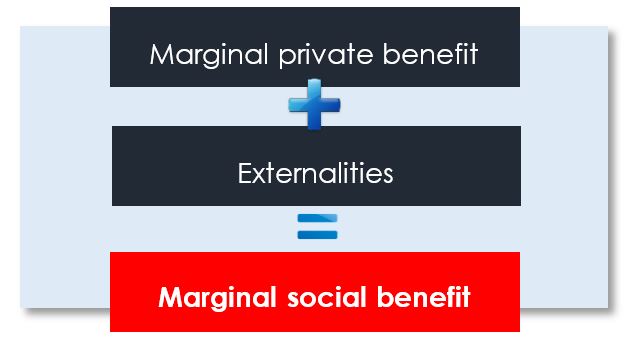
A marginal benefit is the additional satisfaction or utility that a person receives from consuming an additional unit of a good or service. A person's marginal benefit is the maximum amount he is willing to pay to consume that additional unit of a good or service. Marginal social benefits are the benefits to society from the consumption on one more unit of a good or service. There are times when the marginal private benefit does not equal the marginal social benefits, take two examples, influenza vaccinations and cigarettes.
Sugar, a failure of the market?
|
Diminishing marginal returns
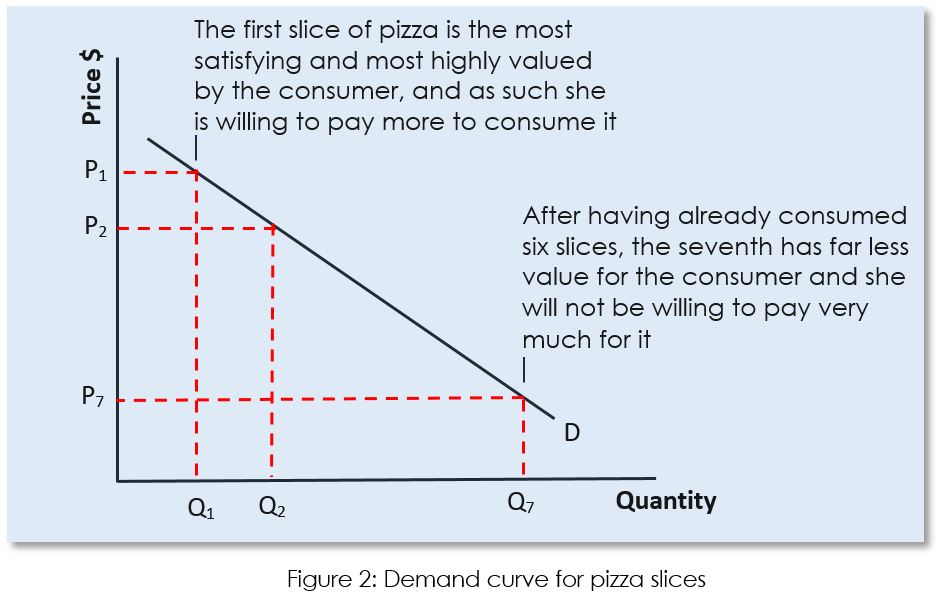
The marginal benefit is the demand curve because:
|
Social benefits and social costs
Private vs social benefits
Differentiate between marginal private benefits and marginal social benefits:
|
Private vs social costs
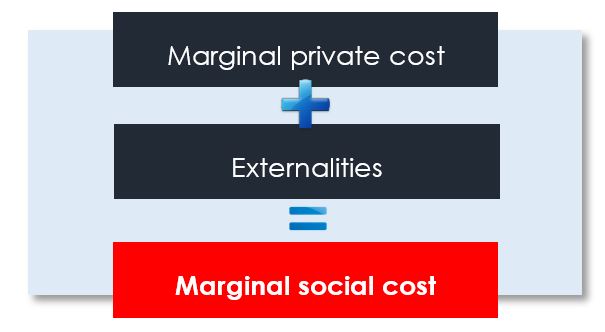
Differentiate between marginal private costs and marginal social costs:
|
Externalities and market failure
Externalities result in market failure.
Externalities cause the market to fail to achieve a social optimum where MSB = MSC, and this will occur for two reasons:
|
What is an externality?
Thus, when there are positive externalities society gains. The MSB or MSC is greater than the MPB or MPC, but at the free market price the good or service will be overpriced and under produced and under consumed.
Conversely, when there are negative externalities society loses. The MSB or MSC is less than the MPB or MPC, but at the free market price the good or service will be under-priced and over produced and over consumed. |
Negative externalities of production and welfare loss
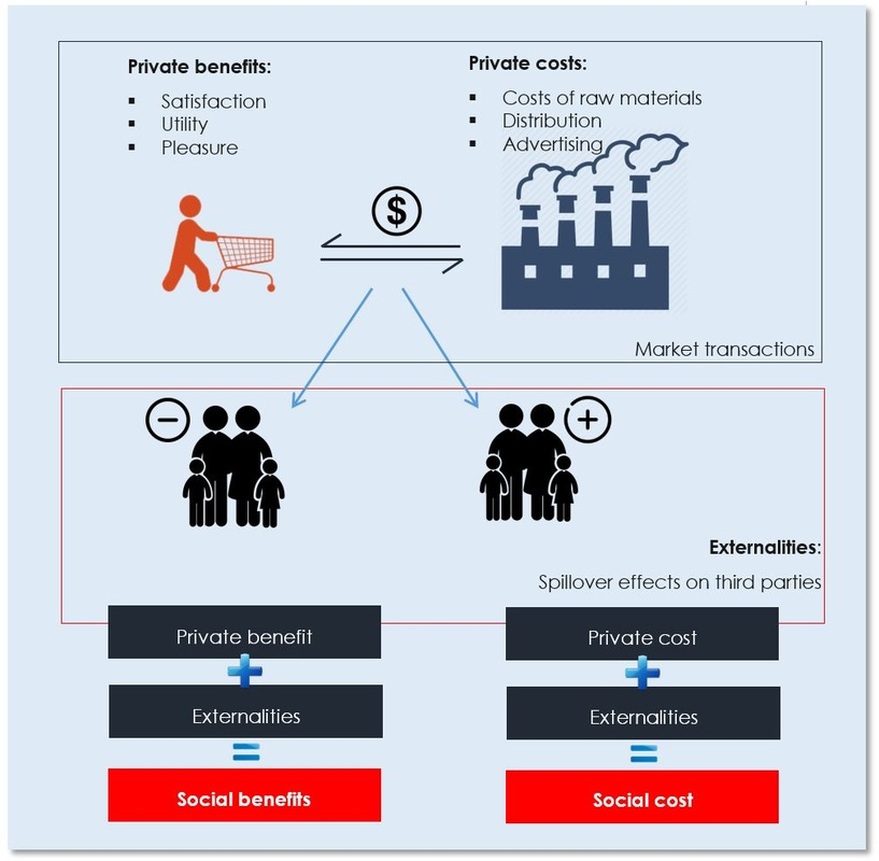
Essential statement: A private cost is a cost that firms incur in producing goods and services to supply the market, such as wages and rent (i.e., costs of production). Negative externalities of production, or the external costs affecting third parties, are created by firms in the process of producing goods and services, however, they do not pay these costs (e.g., the healthcare costs associated with a factory’s air pollution). In a free market, third parties – whom are external to the market – pay for any negative external costs, not the firms creating them. Those in society who are experiencing the negative spillover effects of production such as pollution and traffic congestion, are not involved as consumers or producers yet they are still being forced to pay a cost.
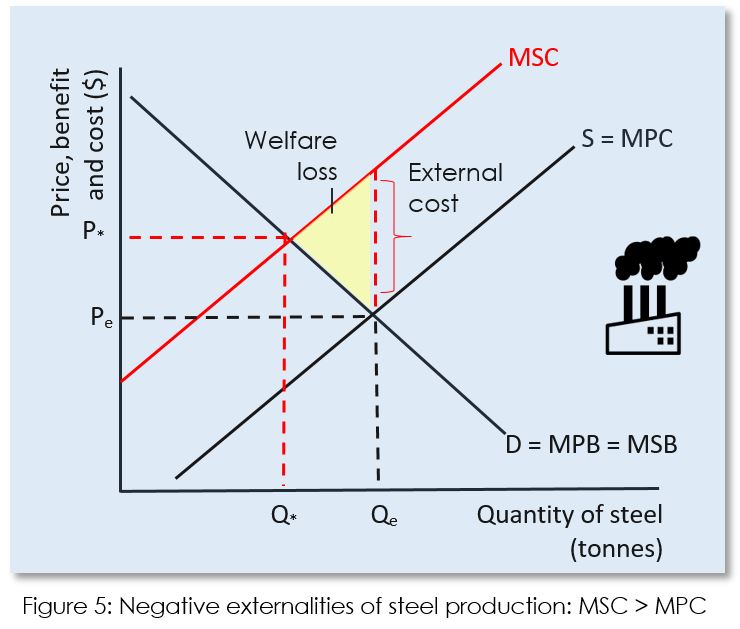
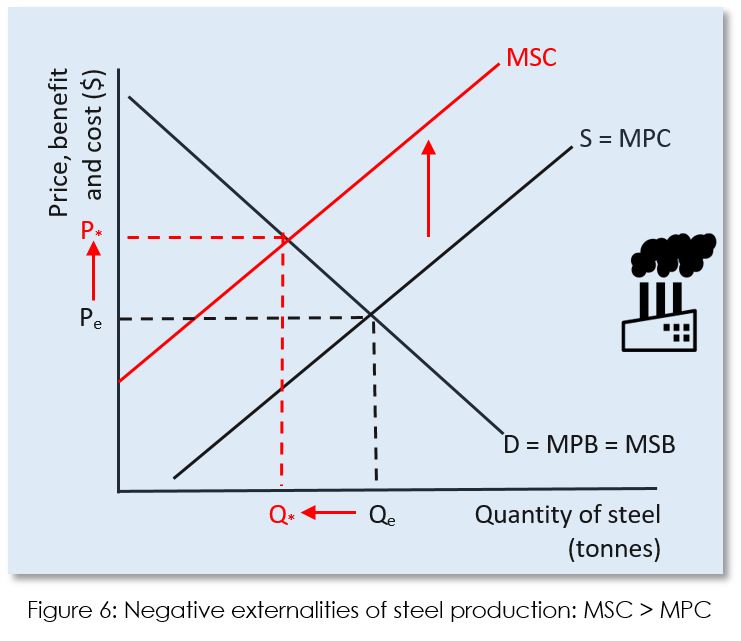
The total of private and external costs equal the social costs associated with production (SC = PC + EC). The additional cost of producing one more unit of a good or service is the marginal private cost. The additional external cost of producing an extra unit of output is the marginal external cost. Thus, MSC = MPC + MEC. Thus, negative externalities of production result in the MSC curve being above and to the left of the MPC curve (see Figure 5 right). World's largest steel producer
|
Steel manufacturing is often very polluting as the lowest cost method of production is to burn lots of coal to provide the energy needed in the steel manufacturing process.
In Figure 5 above, it is assumed that there are only external costs associated with producing steel, and no external benefits. Each tonne of steel produced adds to the surrounding air pollution. Thus, MSB = MPB. The firm producing the good aims to maximise profits and as such does not take into account any external costs associated with producing the next unit of output. The profit maximising firm sets quantity to Qe where the MSB = MPC. This is not the socially optimum level of output because this is where MSB = MSC, and factors of production are being misallocated (e.g., more labour and capital are being used to produce steel, and less labour and capital is being used to produce, say, education and health services). Figure 5 illustrates this. In the free market the price of steel is too low – Pe instead of P* – and the output of steel is too high – Qe instead of Q*. Thus, between Q* and Qe, MSC > MSB. The value of the resources used to make additional tonnes of steel (MSC) is greater than the satisfaction gained from society buying and consuming another tonne of steel (MSB). Thus, MSC > MSB in regards to steel production and consumption. On and every unit of output (tonnes of steel produced) between Q* and Qe, a loss of social welfare occurs. The MSC is less than private benefit of steel consumption because of the negative externalities associated with the production of that good. The yellow triangle shows the total welfare loss. |
Correcting negative externalities of production
|
There are different methods that governments can turn to cope with external costs and these methods tend to fall into one of two categories: government regulations (e.g., pollution limits) or market-based policies (e.g., pollution charges or taxes).
Government regulations
Governments can enact legislation and regulate firms to reduce or prevent the spillover costs associated with negative production externalities. If firms are polluting then governments may ban the dumping of toxic waste and materials into the environment, such as a factory using a river to dump its waste. More often than not, legislation and regulations do not result in a total ban on firms producing pollutants, rather government legislation aims to achieve:
|
Being forced to install new technology increases the costs of production faced by firms and this decreases supply. Similarly, firms that are required to limit their pollutants will have to adopt new and higher cost production processes, which again, decreases supply. And, being forced to limit the output of goods which pollute increases the marginal costs of production as economies of scale can no longer be achieved. Higher marginal costs will also decrease supply to the market.
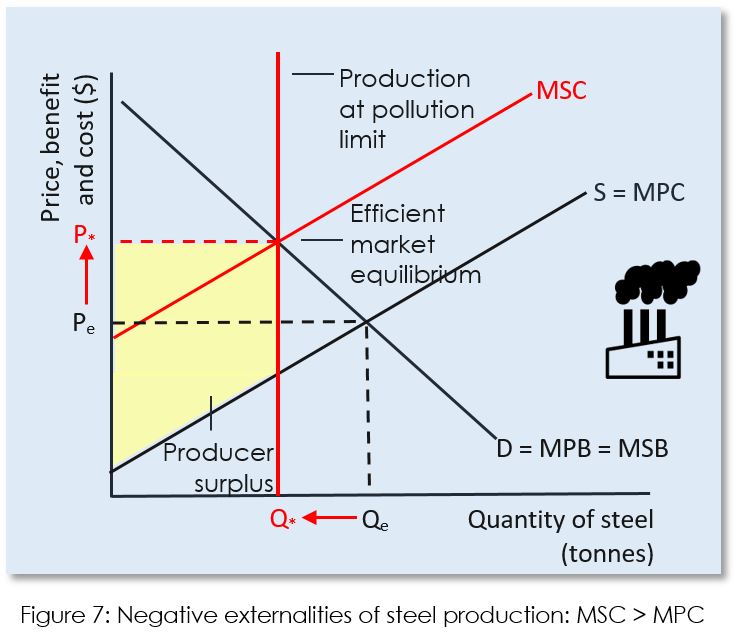
The higher costs of production which decrease supply of the products associated with the external costs would ideally be equal to the value of the negative externality. By regulating the firms producing the good and increasing their costs of production the government aims to achieve a shift of the MPC curve upwards to a point where it overlies the MSC curve and the allocatively efficient supply of the polluting good is achieved. The overallocation of resources (factors of production) to the production of a good imposing external costs on third parties is corrected. Any polluting firm not in compliance with regulations and legislation governing pollutants would be required to face fines and/or legal sanctions such as criminal charges being laid against a company’s directors. A pollution limit can also be modelled as follows: In figure 7 above, we can see that production is limited at a set quantity of output that limits production in accordance with the level of pollution quantity of output set by the government.
|
Market-based policies
There are market-based policies providing governments with tools to correct for negative externalities of production – taxes and tradable permits (cap and trade schemes).
Taxes
Pollution taxes seek an efficient outcome by making a polluter pay the marginal external cost of pollution. Pollution charges have been used only modestly in the United States, but are common in Europe.
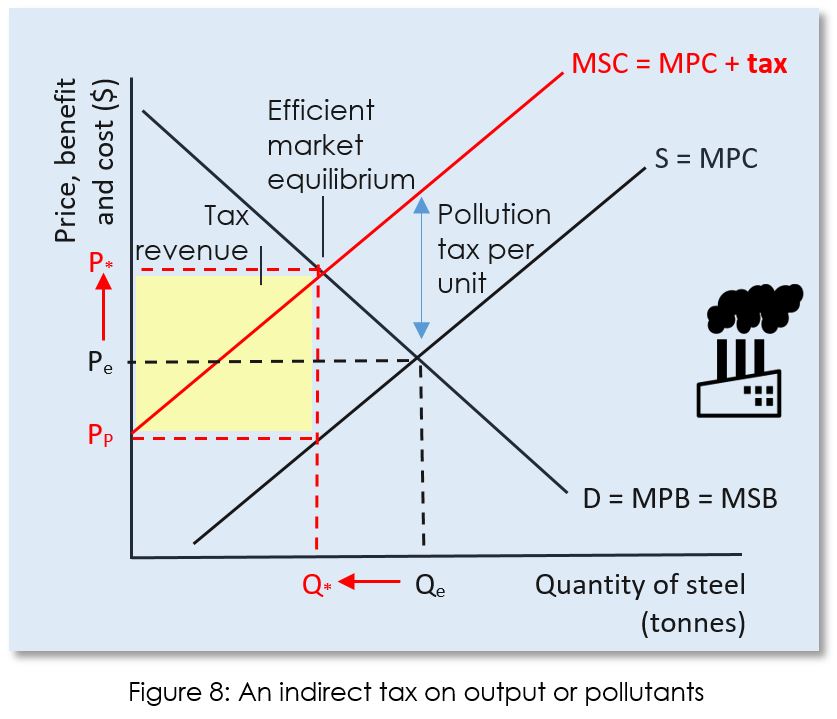
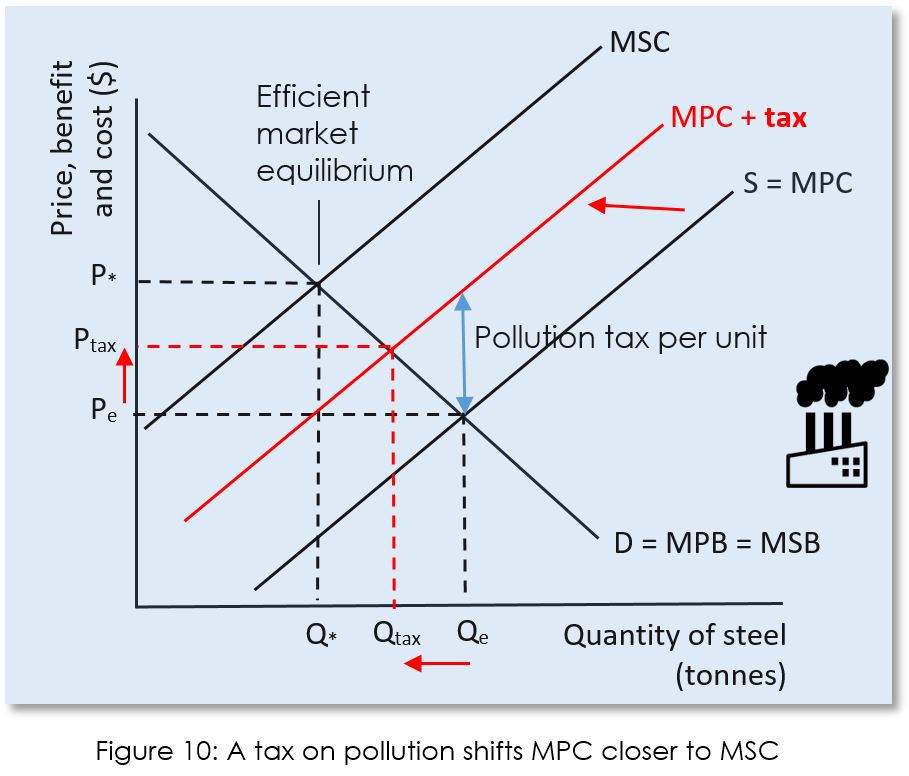
Governments could either impose a tax on each unit of output produced by the firm, or they could tax per unit of pollutant that is being emitted (e.g., a carbon tax). Figure 8 illustrates the effects of a pollution tax. By charging or taxing the producer at a rate equal to marginal external cost, the marginal social cost curve becomes the market supply curve. The market price rises, the quantity produced decreases to the efficient quantity, and the government collects tax revenue of an amount shown by the yellow rectangle. The tax results in supply decreasing, shifting up and to the left, from S = MPC to MSC = (MPC + tax). The most efficient per unit tax is one that is exactly equal to the external costs associated with pollution. The government aims to achieve a shift of the MPC curve upwards to a point where it overlies the MSC curve and the allocatively efficient supply of the polluting good is achieved.
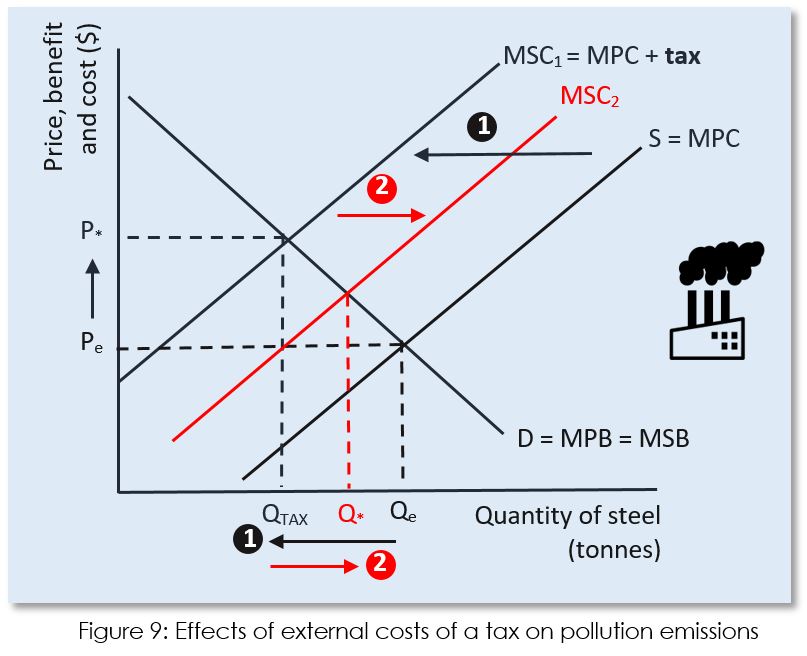
The new equilibrium that is achieved after the tax is imposed is that of the intersection of MSC and the demand curve (MPB). The tax results in a higher price being paid by consumers (P*) and a lower price being received by producers (PP), and at the higher price the allocatively efficient quantity of the good is being produced and consumed. Per unit axes on the output of a polluting good being produced or a per unit tax on the actual pollutant emitted in the production of a good, appears superficially, to have the same result. However, they both work quite differently. The per unit tax on the output of goods correcting for the external costs associated with production, works by affecting the allocation of resources within the economy away from the polluting good to a more allocatively efficient use. This results in Q*, the allocatively efficient amount, being produced by firms in the market that are imposing external costs on third parties. The per unit tax on the quantity of pollutant being emitted works by incentivising firms to adopt better, more allocatively efficient, production processes that reduce the amount they pollute, and therefore, reduce the cost of production to firms. This tax is a two-step process (see Figure 9 below):
Essential statement: A tax on pollution makes the ‘polluter pay’, and thus internalises the externality. The costs that were forced onto and paid by third parties are now paid by the producers and consumers who are producing and consuming in the market. Market-based solutions
Evaluating tradeable permitsa Tax on Carbon EMISSIONS |
Tradeable permits
Marketable pollution permits (also called cap-and-trade) seek an efficient outcome by assigning or selling pollution rights to individual producers who are then free to trade permits with each other.
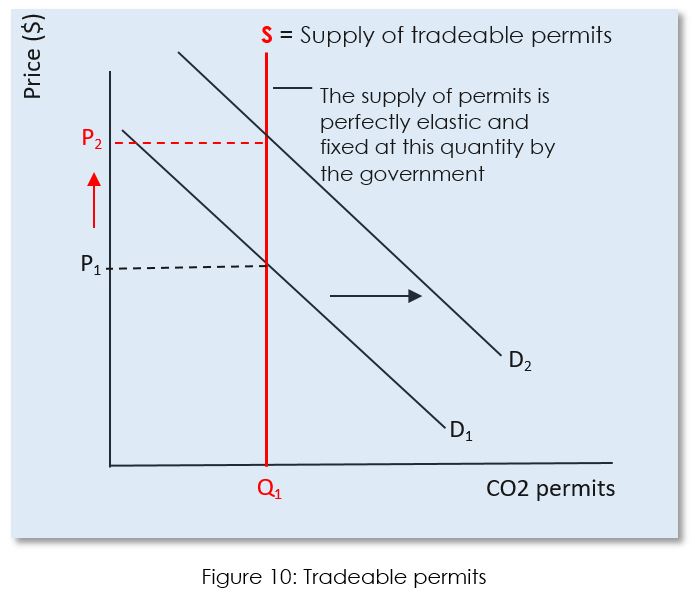
Cap and trade schemes are another market-based approach to controlling emissions that impose costs on third parties. They are used by some governments to control greenhouse gas emissions, the primary driver of global warming, as well as other pollutants. The “cap” sets a limit on emissions, which is lowered over time to reduce the amount of pollutants released into the atmosphere. For example, a small country such as New Zealand may set a cap for its most polluting industries at 40 million tonnes of CO2, and this cap will have staged decreases over time – say 30 million tonnes in 2025, 25 million tonnes in 2030, and so on. The “trade” creates a market for carbon allowances, helping companies innovate in order to meet, or come in under, their allocated limit. The less they emit, the less they pay, so it is in their economic incentive to pollute less. A cap sets a maximum allowable level of pollution and penalises companies that exceed their emission allowance. The cap is a limit on the amount of pollution that can be released, measured in billions of tons of carbon dioxide (or equivalent) per year. It is set based on science. It covers all major sources of pollution. The cap should limit emissions economy-wide, covering electric power generation, natural gas, transportation, and large manufacturers. Emitters can release only limited pollution. Permits or “allowances” are distributed or auctioned to polluting entities: one allowance per ton of carbon dioxide, or CO2 equivalent heat-trapping gases. The total amount of allowances will be equal to the cap. A company or utility may only emit as much carbon as it has allowances for. Industry can plan ahead. Each year, the cap is ratcheted down on a gradual and predictable schedule. Companies can plan well in advance to be allowed fewer and fewer permits – less global warming pollution – each year. Trading leads to investment and innovation. Some companies will find it easy to reduce their pollution to match their number of permits; others may find it more difficult. Trading lets companies buy and sell allowances, leading to more cost-effective pollution cuts, and incentives to invest in cleaner technology. Unlike with some pollutants, all CO2 goes into the upper atmosphere and has a global – not local – effect. So it doesn’t matter whether the factory making the emission cuts is in Boston, Baton Rouge, or Berlin, it reduces global emissions. Companies can turn pollution cuts into revenue. If a company is able to cut its pollution easily and cheaply, it can end up with extra allowances. It can then sell its extra allowances to other companies. This provides a powerful incentive for creativity, energy conservation and investment – companies can turn pollution cuts into dollars. The option to buy allowances gives companies flexibility. On the other hand, some companies might have trouble reducing their emissions, or want to make longer-term investments instead of quick changes. Trading allowances gives these companies another option for how to meet each year’s cap. The same amount of pollution cuts are achieved. While companies may exchange allowances with each other, the total number of allowances remains the same and the hard limit on pollution is still met every year. Figure 10 above shows the market for tradeable pollution permits. The supply of permits is determined by the government and then distributed to firms. Firms cannot emit more pollution than the permits they have allow them to. The demand for such permits determines their market price. As the economy grows, the demand for such permits may increase, and so too will the price. Firms will have an incentive to reduce their emissions to reduce their costs of production and/or sell permits to other less efficient firms to earn additional revenues.
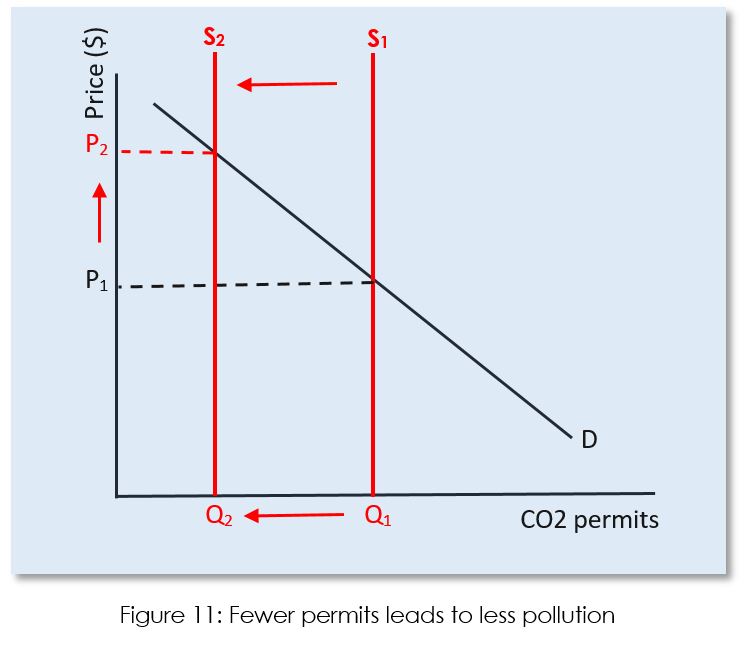
Figure 11 below shows that over time, as the government reduces the supply of the permits to reduce the level of pollution being emitted by firms operating in the economy, and further reducing the external costs imposed on third parties. Governments will usually purchase its own permits circulating in the economy, thus reducing the supply available to firms. As supply is reduced, the price of these permits will increase, providing firms with added incentives to reduce their emissions, and hence, their costs of production. To become more profitable, firms can adopt new technologies and/or substitute to less polluting inputs. |
An evaluation
Advantages of market-based approaches
Most economists prefer the efficiency of market-based approaches to solve the problem of negative production externalities. Taxes and tradeable permit schemes both can internalise the externality – making those consumers and producers in the market (i.e., those parties directly involved in the transaction) bear the real costs of their consumption and production decisions. They pay more, their costs are higher or they adopt new technologies and production methods.
We have seen that taxes on emissions are more efficient and lead to better outcomes than taxes on production output. When firms are taxed on their output of the polluting goods they are producing, they reduce the quantity of output but still produce with the same polluting production technologies and methods. As it affects their competitors equally, there is no incentive to switch to less polluting resources or adopt newer and more expensive technologies. Taxes on the output of emissions which pollute and affect third parties are more efficient. As those firms that can reduce their pollutants stand to become relatively more profitable as their costs of production decrease – these firms will supply more to the market than their higher cost competitors. Thus, there is an incentive to use production methods that pollute less and switch to less polluting resources. Some firms face higher costs in reducing their emissions than other firms do. These firms will be slowest to reduce their emissions and will pay more tax than those firms who find it easier to reduce pollution by changing production processes. Thus, firms who pollute will pay the tax, and this type of tax will lead to less pollution at less overall cost. It is a similar case for tradable permits. Tradeable permits create incentives for businesses to reduce the amount of pollution they create, if the benefits of doing so (reducing the costs paid for permits, selling excess permits) exceed the costs (investing in new technology, using different raw materials). If a firm can reduce its pollution at a relatively low cost, then to maximise profits, it will do so and their excess permits will be sold into the tradeable permits market earning the firm additional revenue. However, firms where reducing polluting emissions is relatively costly, will be forced to purchase extra permits in the market for tradable permits. Thus, the incentives to reduce pollution and decentivise to pollute created by the tradeable permits system, shift productive resources in the economy away from increasingly less profitable polluting industries and into relatively more profitable industries. The desired result of less overall pollution at less overall cost is therefore achieved. |
Disadvantages of market-based policies
There are considerable technical difficulties in designing a tax or tradeable permit system that effectively tackles firms and industries that pollute. There are several issues that need to be carefully assessed, including:
Tradeable permits themselves carry a few additional disadvantages:
Generally speaking, pollution taxes and tradeable permits will only shift the MPC closer to the MSC curve (see Figure 10), and it is unlikely that either of these market-based government interventions to correct for market failure would achieve the desired outcome – achieving an efficient market equilibrium (MSC = MSB). |
Advantages of government regulations
|
Disadvantages of government regulations
|
Negative externalities of consumption and welfare loss
Essential statement: A private benefit is gained by consumers from the consumption of goods and services. The consumption of certain goods and services can create external costs (negative externalities) that spillover from private consumption that must be paid for by third parties. Negative externalities of consumption refer to the external costs created by the consumers during the course of using the product or service.
A classic example is the consumption of cigarettes. There is a private benefit to the smoker as she purchases and consumes cigarettes. There is also a cost to society imposed by the smoker on third parties. The consumption of cigarettes affects others indirectly – passive smoking, higher healthcare costs (higher taxes being paid), less productivity in the work place (through ill health), and so on and such forth. Essential statement: Demerit goods are goods and services that create negative externalities when they are consumed. Examples include, cigarettes, drugs and alcohol, sugar and junk food, petrol, cars and coal. The consumer when deciding how much of a good or service to consume does not necessarily consider what external costs their consumption may impose on others. Only the marginal private costs and marginal benefits are considered, and the level of consumption is determined where the marginal private cost (MPC) = marginal private benefit (MPB). This is where the cost to the cons
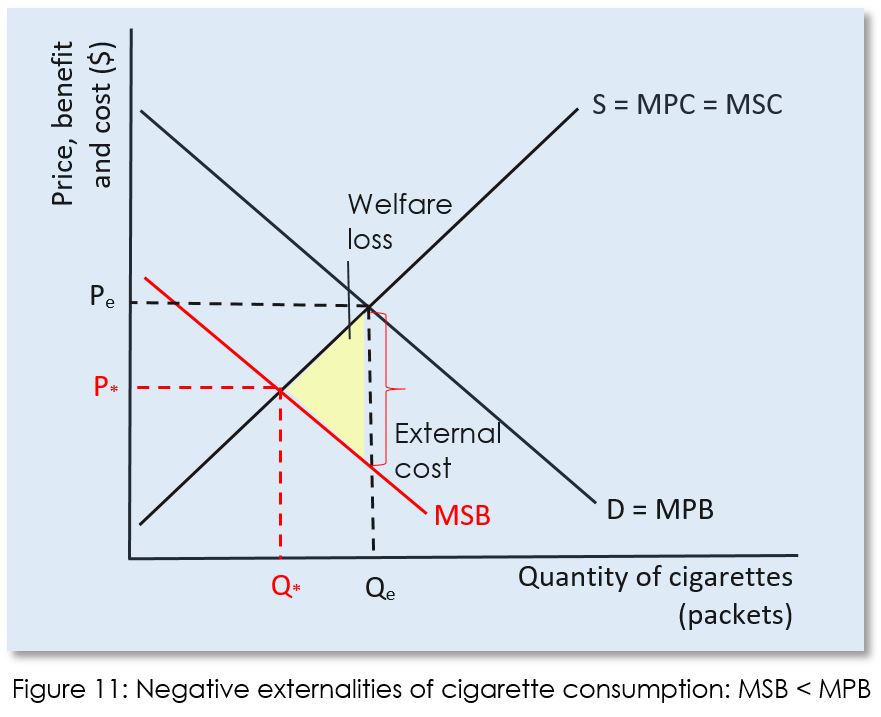
In a free market, third parties – whom are external to the market – pay for any negative external costs. Those in society who are experiencing the negative spillover effects of consumption such as second-hand smoking (cigarettes) and traffic congestion (cars), are not involved as consumers or producers yet they are still being forced to pay a cost. The additional benefit of consuming one more unit of a good or service is the marginal private benefit. The additional external benefit obtained or harm caused by consuming an extra unit of a good or service is the marginal external benefit. Thus, MSB = MPB + MEB. Thus, negative externalities of consumption result in the MSB curve being below and to the left of the MPB curve (see Figure 11 below). In Figure 11 above, it is assumed that there are no external positive effects from cigarette consumption on third parties, only harm. Each packet of cigarettes consumed affects others through the unpleasant and harmful effects of second hand smoking, and reduces worker productivity and adds to the healthcare costs of society.
Thus, MPB > MSB. The individual consumer is aiming to maximise her satisfaction and does not take into account any external harm she is causing when consuming the next packet of cigarettes. She maximises her utility at the point where marginal private cost equals marginal private benefit. This is where the cost (price paid) to the consumer of consuming an additional unit of a good is equal to the value of the additional benefit that is to be gained from consuming one more additional unit of a good. Qe is the optimum level of individual private consumption at the price Pe. However, because cigarette consumption negatively affects others, the benefit gained by the private consumer is greater than the benefit obtained by society as a whole. Thus the MSB < MPB. The allocatively efficient point of consumption is Q* which is less than Qe. In the free market Qe is achieved because the price of cigarettes is too low, and at the low price too many cigarettes are being consumed. The yellow triangle shows the total welfare loss. Externalities
Externalities: Taxes & subsidies
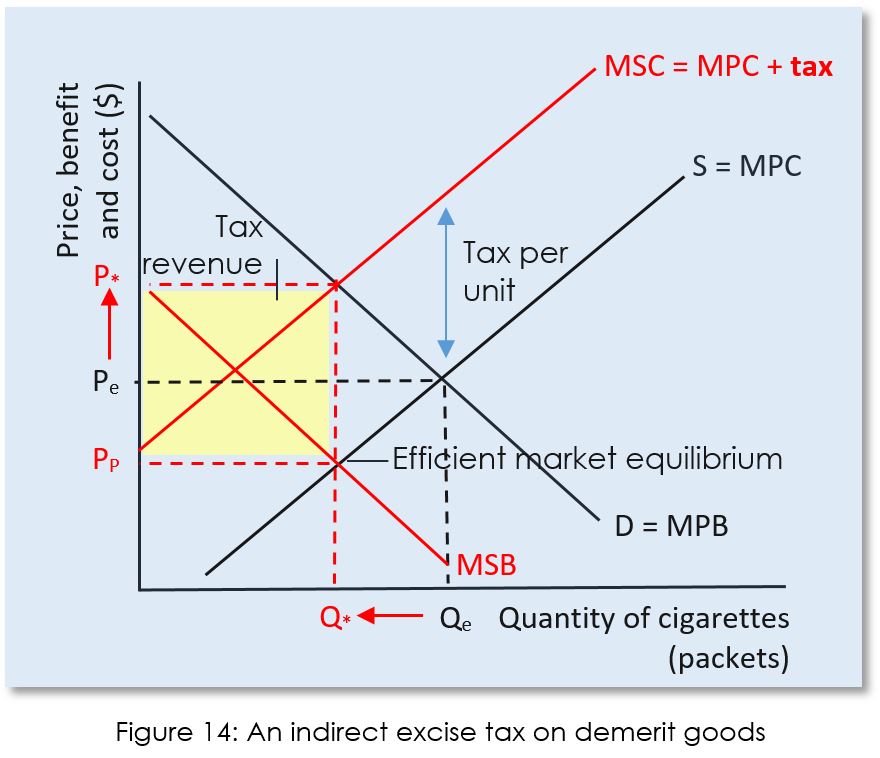
Essential statement: The other way to internalise a negative externality of consumption is to place an indirect excise tax on the good or service. This will not decrease the demand for the demerit good, however the higher price will decrease the quantity demanded for the demerit good, to a quantity equivalent to that achieved when MSB = MPC. The excise tax shifts the MSC left to a point where it intersects with MPB directly in line with the efficient market equilibrium. |
Correcting negative externalities of consumption
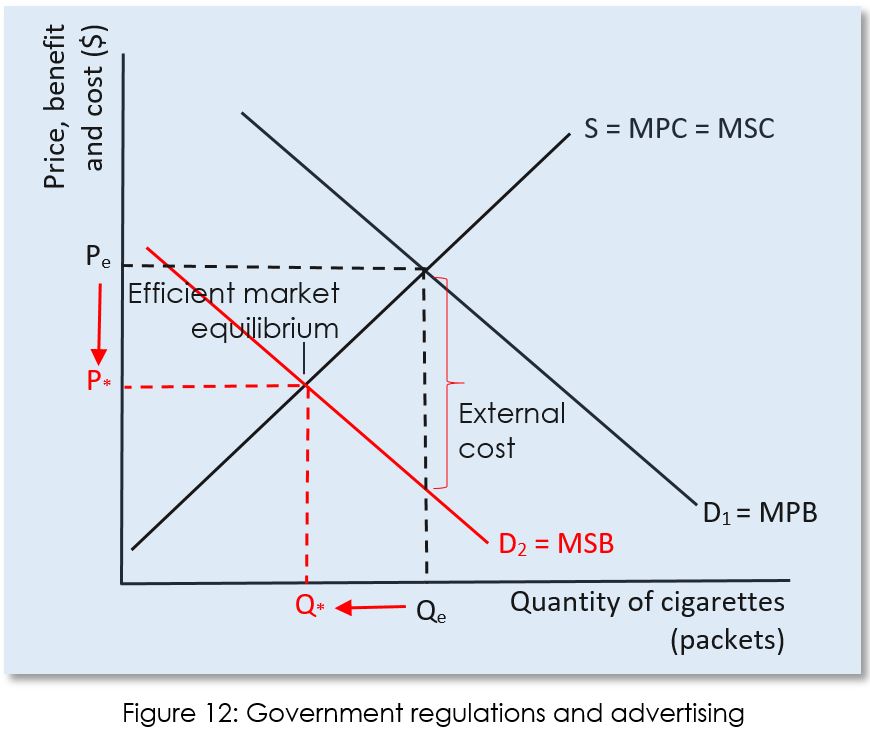
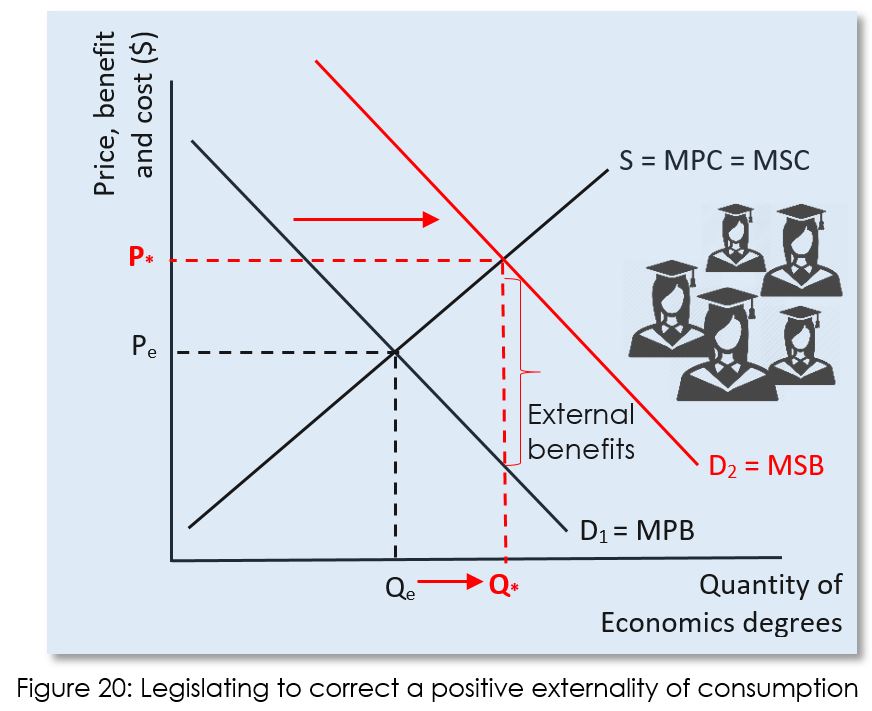
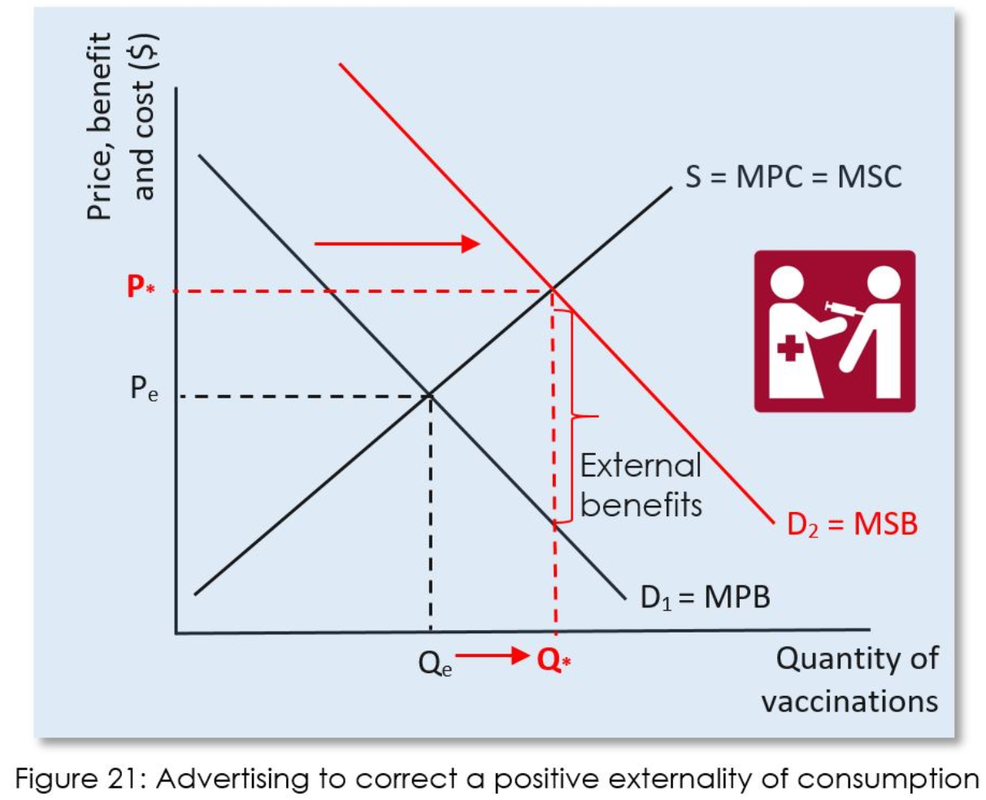
A government can regulate to correct a negative externality of consumption. For example, regulating that cigarettes can only be sold to those aged 18 and over, and that cigarettes cannot be smoked in workplaces, cafes, bars and restaurants will reduce the demand for cigarettes. The demand curve will decrease from D1 = MPB until it overlaps with D2 = MSB, the socially desirable level of demand where the externality has been eliminated (internalising the externality). As demand decreases, the important effect is that Qe decreases to Q*; and (unimportantly) price reduces from Pe to P* as producers lower their prices to reduce the surplus (excess supply) of the demerit good. See Figure 12, below.
For example, health campaigns and advertisements that demonstrate the harm cigarettes do will reduce the demand for cigarettes. The demand curve will decrease from D1 = MPB until it overlaps with D2 = MSB, the socially desirable level of demand where the externality has been eliminated (internalising the externality). As demand decreases, the important effect is that Qe decreases to Q*; and (unimportantly) price reduces from Pe to P* as producers lower their prices to reduce the surplus (excess supply) of the demerit good. See Figure 12, above. Market-based policies
There are market-based policies providing governments with tools to correct for negative externalities of consumption, namely the imposition of indirect (excise) taxes. An excise tax is an indirect type of taxation imposed on the manufacture, sale or use of certain types of goods and services, especially those considered harmful. In theory it is possible to design and administer a consumption tax which consumers pay directly to the government. If it could be achieved it would have the effect of reducing demand for the demerit good (i.e. the demand curve would shift left). However, it is difficult to tax consumers directly to correct for their negative externalities of consumption. It is far easier to administer excise taxes that are paid to the government by firms – indirect excise taxes. Taxes Indirect taxes seek an efficient outcome by making both the consumer and the consumer to pay the marginal external cost of pollution. Almost all developed countries have an excise tax of cigarettes, and these sales taxes can account for over 80% of the price of a packet of cigarettes (e.g., Finland). However, it should be noted that there is wide variation between and even within countries. For example, the US state of Missouri has an exceptionally low tax of 17 cents per packet. Governments impose an excise tax on each unit of output produced and sold by the firm. Consumers and producers share the burden of the indirect tax, but because cigarettes are addictive the demand curve is inelastic and consumers will bear the greatest burden. The reason for this is that for inelastic goods and services, the quantity demanded decreases less than for more elastic goods and services. Thus, more consumers continue to purchase the product and pay the tax; see Figure 13 below. The new equilibrium that is achieved after the tax is imposed is that of the intersection of MSC and the demand curve (MPB). The tax results in a higher price being paid by consumers (P*) and a lower price being received by producers (PP), and at the higher price the allocatively efficient quantity of the good is being produced and consumed. Thus, the negative externality of consumption has been internalised.
Essential statement: The allocative efficient point of consumption is where MSB = MPC. One way that negative externalities of consumption can be internalised by decreasing the demand for the product and shifting MPB left to where it overlaps the MSB curve. This can be achieved through advertising or government regulation. |
An evaluation
Advantages of market-based approaches
Most economists prefer the efficiency of market-based approaches to solve the problem of negative production externalities. Indirect excise taxes can internalise the externality – making those consumers and producers in the market (i.e., those parties directly involved in the transaction) bear the real costs of their consumption and production decisions. Consumers pay more for a product, and thus indirect taxes, which change the relative prices of goods and services, provide incentives for consumers to change their consumption habits. As the quantity demanded falls, consumers will switch to other purchases which provide them with greater satisfaction per dollar spent. Additional price signals are communicated to producers as their total revenues fall in the face of an indirect tax (a lower price received and decreased quantities supplied), and it becomes relatively less profitable for firms to supply the demerit good. As a result, resources are shifted into more productive areas of the economy.
Thus, consumers who adversely affect others with their consumption will pay the tax, and those firms supplying the demerit good will also pay, thus, this type of tax will lead to less of the undesirable product being produced and consumed at less overall cost. Cigarette consumption
|
Disadvantages of market-based policies
There are considerable technical difficulties in designing a tax system that effectively tackles the negative spillover effects of consumption. There are several issues that need to be carefully assessed, including:
|
Positive externalities of production and welfare loss
|
A positive externality of production is a situation where a firm producing a good or service creates an external benefit that spills over and is enjoyed by third parties whom are external to the market. In other words, society benefits when a firm creases a certain good or a service over and above the private benefits from producing that good or service (e.g., shareholder profit).
Examples of positive externalities of production include:
Thus, third parties or individuals and groups external to the market are benefiting from the production decision without having to pay a cost. And the firm continues to receive the private benefit (e.g., profit). Honey Production
The production of honey provides perhaps the best example of a positive externality of production. Beekeepers are in the business of making honey. At the same time their bees make agriculture and horticulture possible.
|
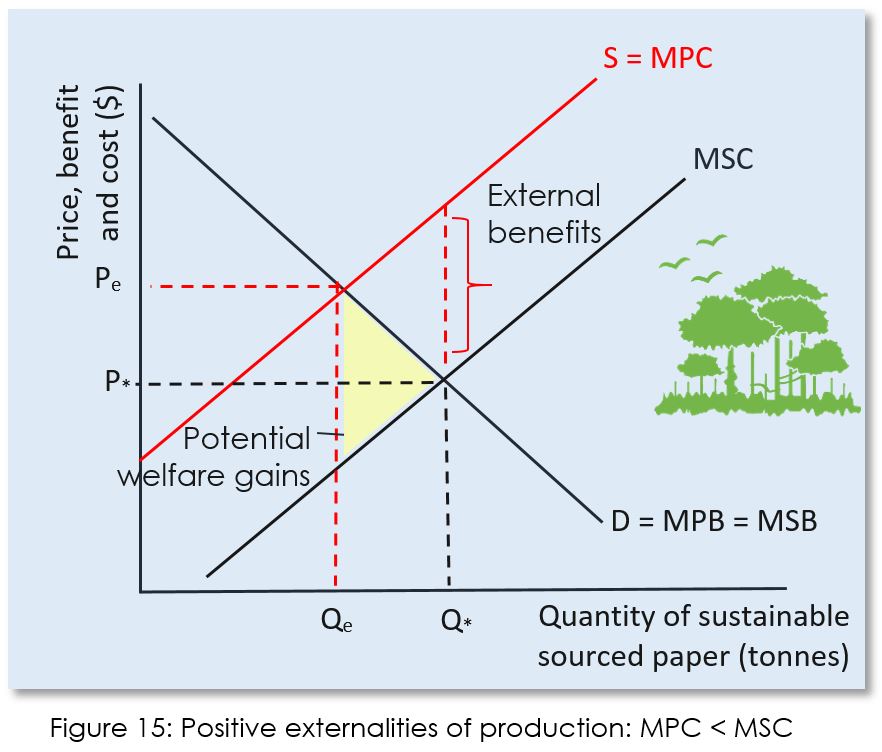
The firm’s marginal private cost is higher than that of the marginal social cost because the benefits are not internalised in the competitive free market. Thus MPC > MSC. The firm will set output at Qe – the optimum private level – MPC = MSB (see Figure 15 below). At the market equilibrium Qe, MSB > MSC and this is an allocatively inefficient market outcome because at Qe the benefits to society from the next additional unit of output produced are greater than the value of the resources employed by the firm to produce it. MSB > MSC for the level of output between Qe and Q*. This area of allocative inefficiency is shown in the yellow shaded triangle and it represents the potential welfare gains that additional production could produce. At Q* the marginal social benefits equals the marginal social cost and this is the optimal level of production because the benefits to society from the next additional unit of output produced are equal to the value of the resources employed by the firm to produce it.
At the equilibrium where MSC = MSB, the social optimum equilibrium, P* and Q* results – a lower price and a greater quantity of the good or service is produced and consumed in the market. Whereas, at the free market equilibrium where MSC = MSB, the allocatively inefficient equilibrium, Pe and Qe results – a higher price and a lower quantity of the good or service is produced and consumed in the market. |
Correcting positive externalities of production
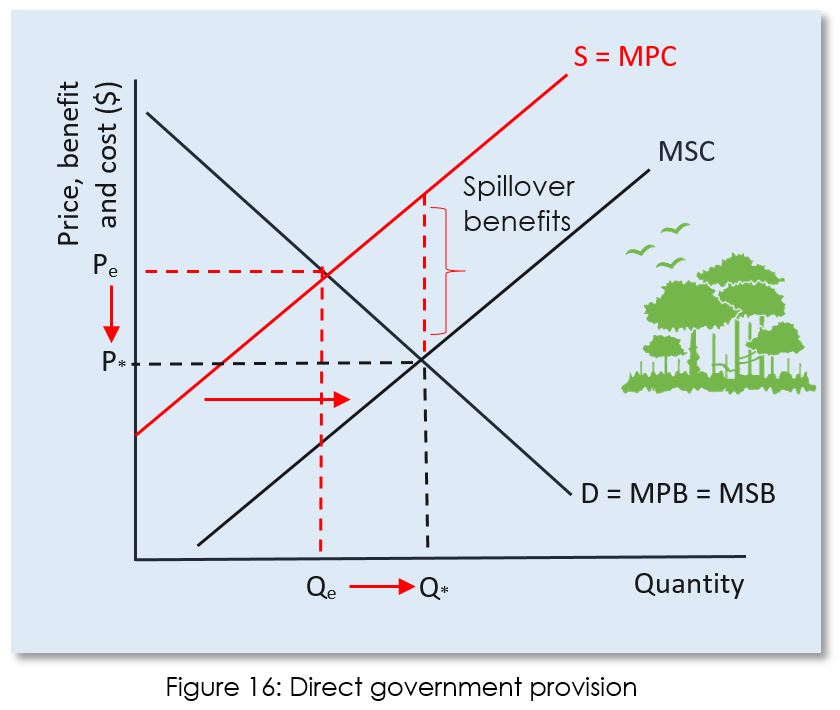
Governments will often directly provide education and training for workers – schools, tertiary institutions such as universities and polytechnics, and back to work courses for the unemployed. All such activities are paid for through government funding that comes from taxes. As can be seen in Figure 16 below, direct provision of the good generating the positive externality of production increases the supply of the good (shifts the supply curve – MPC – right) towards the MSC curve. At MSC the socially optimum quantity of the good or service is produced at Q* and the price will decrease from Pe to P*. Evaluation
Governments will widely use both methods of correcting for a positive externality of production – direct provision and per unit subsidy of a good or service. We have seen that both methods have the same effect on the market outcome. Each method is highly effective in increasing the quantity of the good or service being produced and consumed. Each method has the added benefit of reducing the price paid by consumers for the good or service.
However, it is often difficult to achieve an allocatively efficient market outcome where MSC = MSB, because of several factors:
|
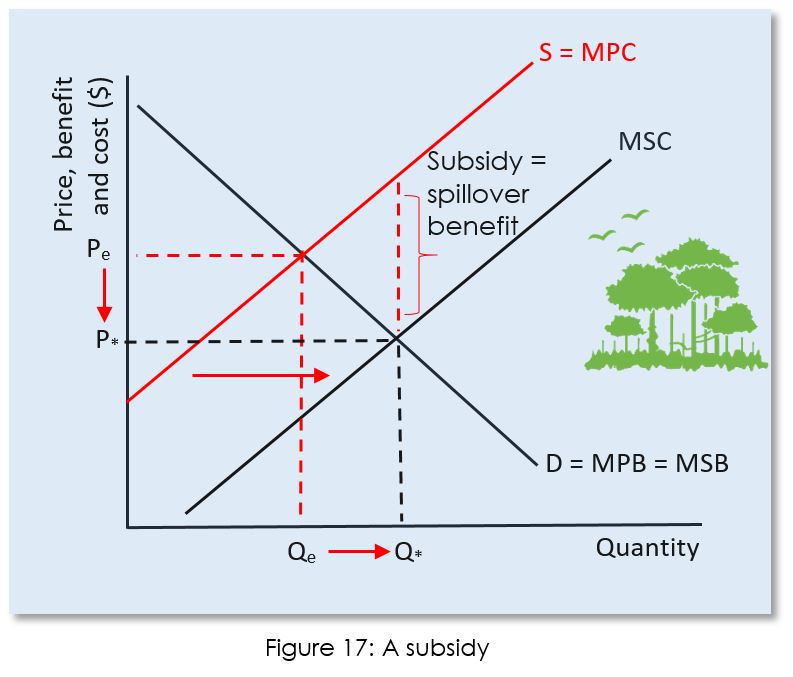
A targeted subsidy can be used by government to correct an allocative inefficiency by correcting a market failure. To fully correct for the market failure caused by a positive externality of production, the government will pay the firm a per unit subsidy that is equal to the value of the external benefit. The marginal private cost curve shifts right until it equals (or overlaps) with the MSC curve (see Figure 17 below). Paying a subsidy to firms producing the good generating the positive externality of production increases the supply of the good (shifts the supply curve – MPC – right) towards the MSC curve. At MSC the socially optimum quantity of the good or service is produced at Q* and the price will decrease from Pe to P*. Essential statement: Both direct provision of a good and paying a per unit subsidy have the same market outcomes. This is because correcting a positive externality of production requires that the MPC curve shifts right towards the MSC curve. To achieve allocative efficiency in the market the quantity produced and consumed in the market must increase from Qe to Q*, and the price must fall from Pe to P*. What is a subsidy?
subsidies and production
|
Positive externalities of consumption and welfare loss
|
A positive externality of consumption occurs when an external or spillover benefit is created by the consumption of a good or service. An example is education. When education is consumed there is both a private benefit to the individual receiving the education (e.g., higher wages and salaries), as well as social benefits such as increased productivity, lower unemployment, lower crime rates, and increased economic development.
Collectively, goods which generate positive externalities of consumption are termed merit goods. Merit goods are those goods and services that the government feels that people will under-consume, and which ought to be subsidised or provided free at the point of use so that consumption does not depend primarily on the ability to pay for the good or service. In other words, society benefits when an individual consumes a certain good or a service over and above the private benefits from consuming that good or service (e.g., marginal utility). Examples of positive externalities of consumption include:
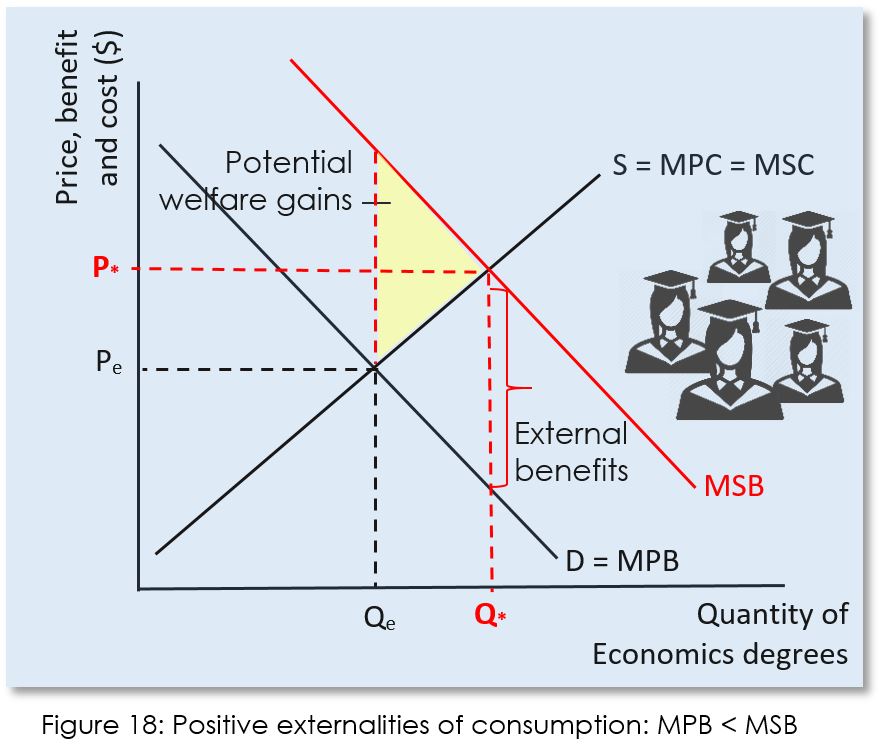
The individual’s marginal private benefit is lower than that of the marginal social cost because the benefits are not internalised in the competitive free market. Thus MSB > MSC. Consumers in the free market will choose to consume at Qe – the optimum private level – MSB = MSC (see Figure 18 below). At the market equilibrium Qe, MSB > MSC and this is an allocatively inefficient market outcome because at Qe the benefits to society from the next additional unit of the good consumed are greater than the value of the benefits gained by the individual consuming it. |
MSB > MSC for the level of consumption between Qe and Q*. This area of allocative inefficiency is shown in the yellow shaded triangle and it represents the potential welfare gains that additional consumption of the good could produce. At Q* the marginal social benefits equals the marginal social cost and this is the optimal level of consumption because the benefits to society from the next additional unit of output consumed are equal to the value of the benefit gained by the individual + society.
At the equilibrium where MSB = MSC, the social optimum equilibrium, P* and Q* results – a lower price and a greater quantity of the good or service is produced and consumed in the market. Whereas, at the free market equilibrium where MPB = MSC, the allocatively inefficient equilibrium, Pe and Qe results – a higher price and a lower quantity of the good or service is produced and consumed in the market. Essential statement: In the free market merit goods are under consumed. Consumers do not consider the external benefits that spillover to others in society when consuming a merit good. MSB > MSC at the optimum level of private consumption. The government must intervene in the market to increase the consumption of merit goods so that it increases to MSB = MSC which is the social optimum level that maximises the welfare of society. |
Merit goods
A merit good is a good/service that the government believes will be under consumed in a competitive free market.
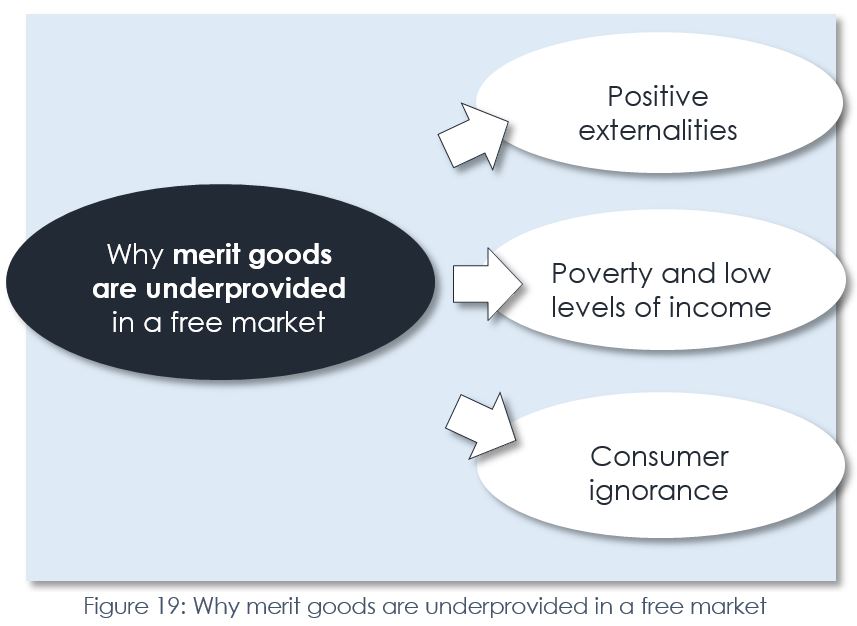
When consumed a merit good will generate a positive externality, and as such, the private benefit of consumption is less than the social benefit of consumption. Consumers do not consider the external benefits that spillover to others in society when consuming a merit good, thus causing the merit good to be underprovided and under-consumed in the free market. Reasons for the under provision of merit goods in the free market include:
|
Note. All factors can be simultaneously affecting the under provision of a merit good. For example, education has positive externalities of consumption in that education has social benefits greater than the private benefits. An education in the free market is expensive – think of how much private school fees or unsubsidised university tuition would be – many individuals could not afford to purchase an education at free market prices because their income levels are too low. Consumers are often ignorant of the benefits that accrue from a good education, such as increased wages and salaries, and rather view it as a personal cost in terms of time and money.
|
Correcting positive externalities of consumption
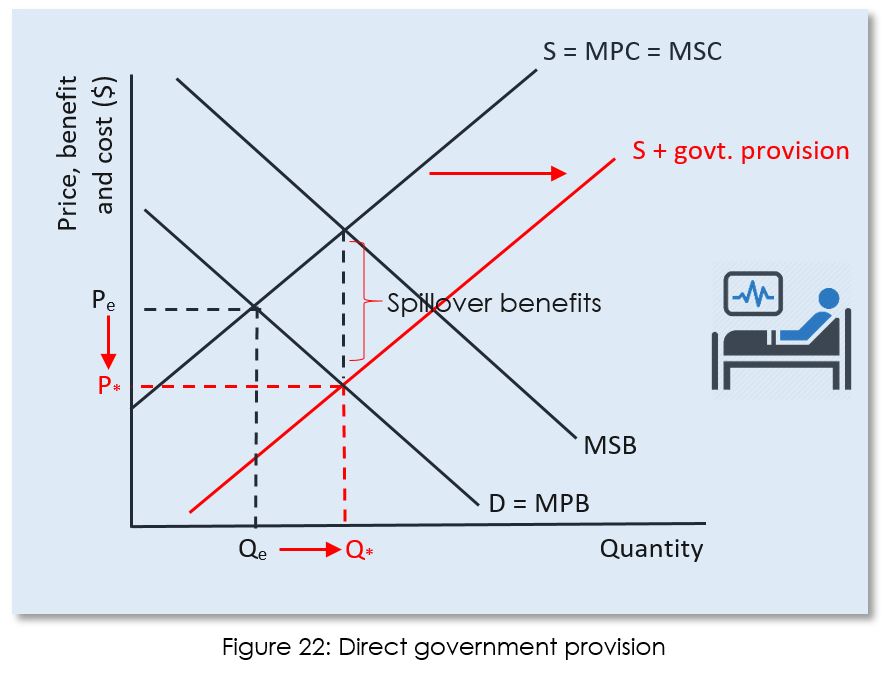
All such activities are paid for through government funding that comes from taxes. As can be seen in Figure 22 below, direct provision of the good generating the positive externality of production increases the supply of the good (shifts the supply curve – MPC – right) towards the MSC curve. At MSC the socially optimum quantity of the good or service is produced at Q* and the price will decrease from Pe to P*. |
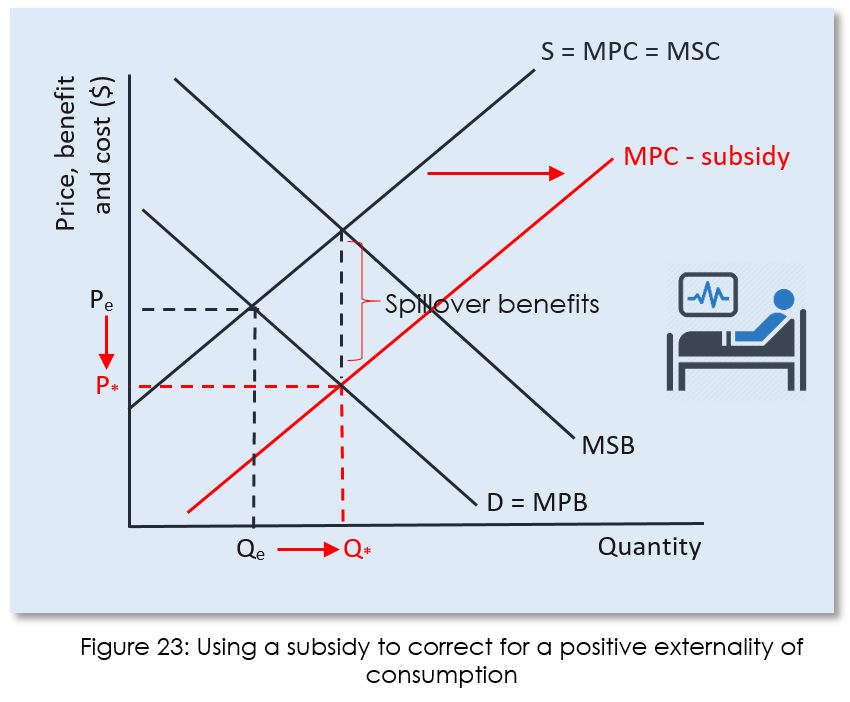
A targeted subsidy can be used by government to correct an allocative inefficiency by correcting a market failure. To fully correct for the market failure caused by a positive externality of consumption, the government will pay the firm a per unit subsidy that is equal to the value of the external benefit. The marginal private cost curve shifts right until it equals (or overlaps) with the MSC curve (see Figure 23 below). Paying a subsidy to firms producing the good generating the positive externality of consumption increases the supply of the good (shifts the supply curve right). If the subsidy is equal to the external benefit then the new supply curve (MPC – subsidy) will intersect with MPB at the Q* level of output and consumption. The socially optimum quantity of the good or service is produced and consumed at Q* and the price will decrease from Pe to P* |
Evaluation
Governments will widely use all methods of correcting for positive externalities of consumption – legislation, advertising, direct provision and per unit subsidy of a good or service.
Regarding direct provision and subsidies, we have seen that both methods have the same effect on the market outcome. Each method is highly effective in increasing the quantity of the good or service being produced and consumed. Each method has the added benefit of reducing the price paid by consumers for the good or service. However, it is often difficult to achieve an allocatively efficient market outcome where MSC = MSB, because of several factors:
|
Legislating and advertising are faced with similar limitations when it comes to calculating the value of external spillover benefits. These strategies are only sometimes effective in increasing the demand for merit goods by shifting the MPB curve (i.e., increasing demand), but not increasing demand sufficiently to bring consumption to Q* - the socially desirable and allocatively efficient point of output and consumption.
Legislation can be tremendously effective if supported with adequate resources. Compulsory schooling effectively increases demand and ensures that education is produced and consumed in quantities that could not be achieved by market-based interventions such as providing subsidies to schools and kindergartens. However, it would be a nonsense for the government to enact such legislation without providing the resources necessary to fulfil such demand – i.e., providing and/or funding places in schools for all school children. Sometimes legislation can be less effective. Take compulsory vaccinations for example. These programmes can be resource intensive to establish, monitor and enforce. And with so much misinformation being provided by anti-vaccine groups, a small but significant groups of parents try to circumvent such laws by refusing to get their children vaccinated. Advertising campaigns can influence demand for some merit goods (sports and activities) but not others. For example, men’s health campaigns struggle to convince most men to see their doctor for a regular prostate exam. Much also depends on the effectiveness of the advertising chosen and not just the message. And in this day and age of advertisement free cable channels such as BskyB and online streaming services such as Netflix, combined with adblockers when browsing the internet, capturing the attention of the target market can be difficult indeed. Student focus question: Evaluate the direct provision of immunisations in the following programme.
|
AP® MICROECONOMICS – POWERPOINT SUMMARY NOTES:
4.1 Externalities
PROGRESS CHECK - TEST YOUR UNDERSTANDING BY COMPLETING THE ACTIVITIES BELOW
You have below, a range of practice activities, flash cards, exam practice questions and an online interactive self test to ensure you have complete mastery of the AP® Microeconomics requirements for the Externalities topic.
USE THE Externalities FLASHCARDS IN ALL THREE STUDY MODES
AP® MICROECONOMICS INTERACTIVE QUIZZES: Externalities
Test how well you know the AP® Microeconomics – Externalities topic with the self-assessment tool. Aim for a score of at least 80 per cent. Each interactive quiz selects 30 questions at random from a much larger question bank so keep on practicing!


